
Create interactive and responsive charts for your website. Main features:
- Using Chart.js (http://www.chartjs.org/)
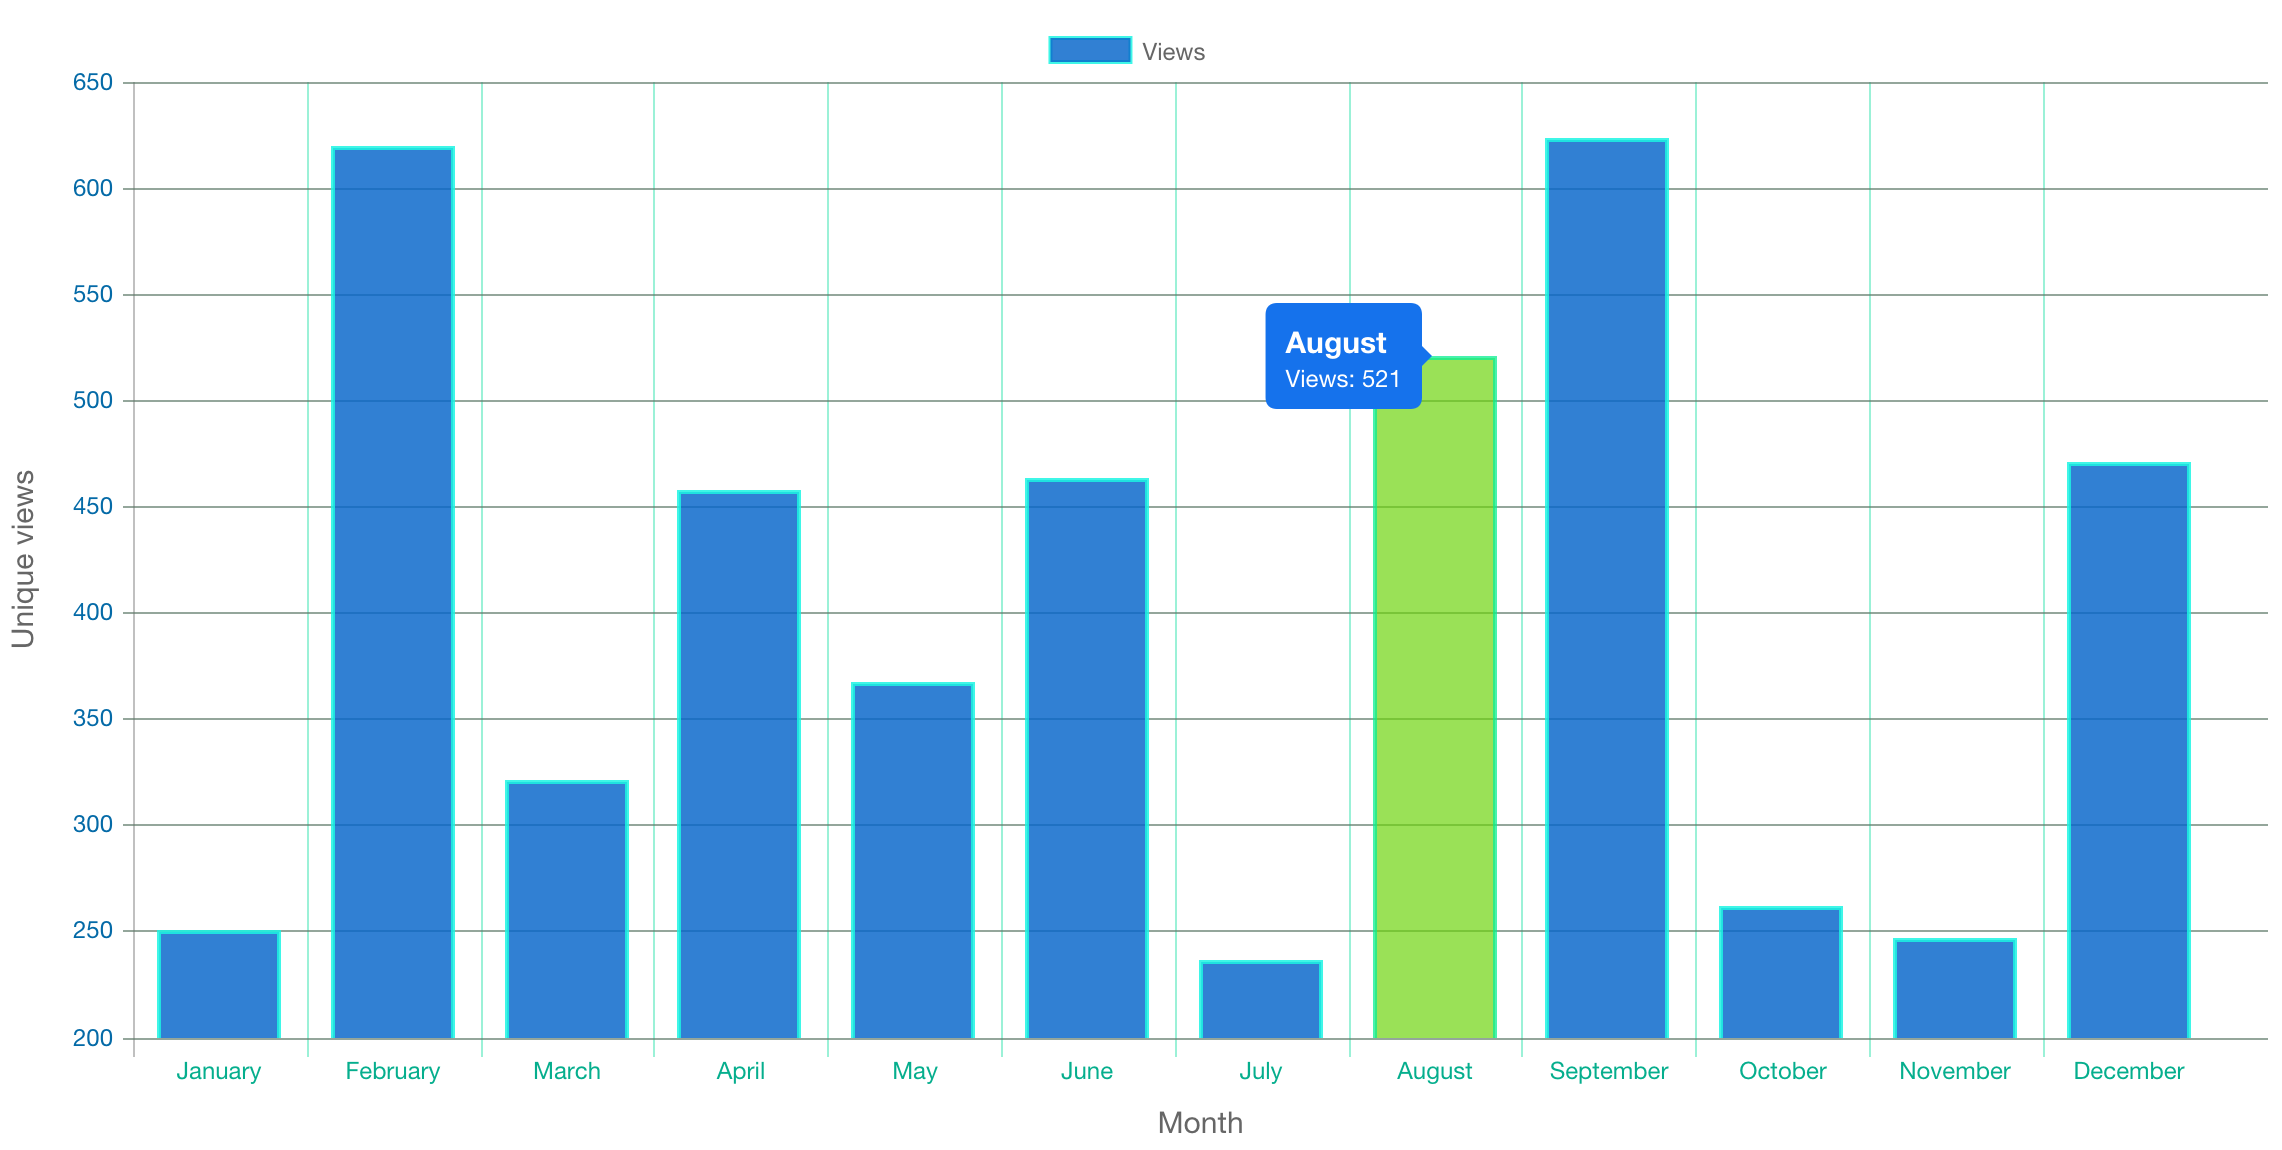
- Select from 6 different charts (Pie, Doughnut, Line, Bar, Radar and Polar Area)
- Data can be uploaded from CSV file or Google Sheet
- Choose from many different animations
- Customize colors, font styles, legend position etc.
- Responsive charts
- Ability to have as many datasets as you want
